The visual research desk · 3 free downloads
Testosterone and fertility, explained in three diagrams.
See the hormone pathway, separate the study endpoints, and understand why injection-route claims need product context. Download a diagram for a conversation or a post, with its source date and explanation attached.
Original illustrations by PeakedLabs Editorial Team. Sources checked . Educational summaries; they do not diagnose, choose treatment or teach injections.
Where testosterone comes from—and what feedback changes
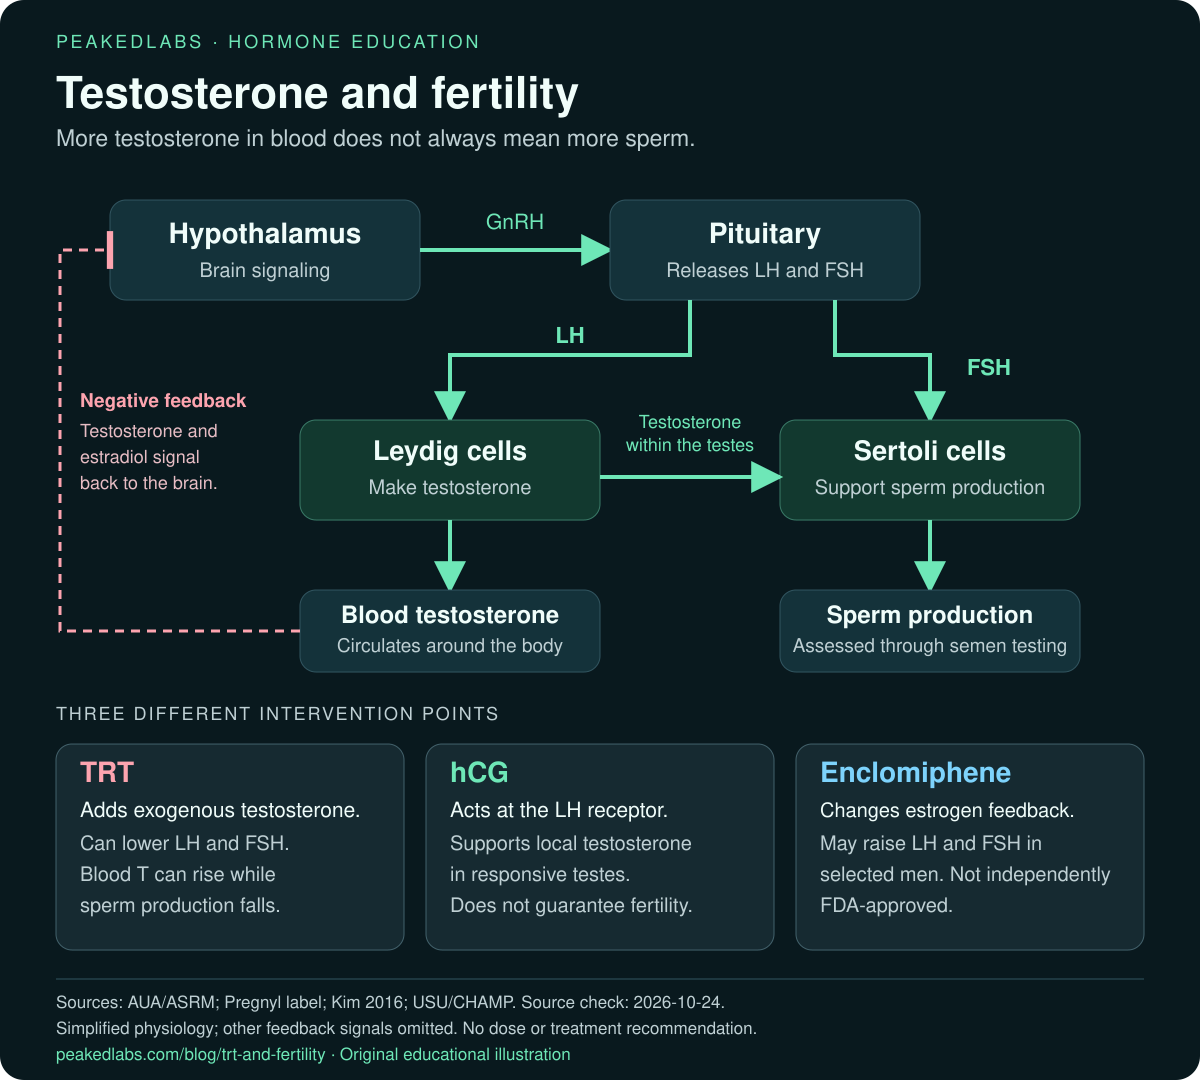
A blood testosterone result does not show what is happening inside the testes or whether sperm production is adequate.
PNG: 1200 × 1080 pixels for sharing. SVG: scalable version for a closer look.
Caption to use with the image
Testosterone production and sperm production share a hormone feedback system. TRT supplies testosterone from outside the body; hCG and enclomiphene act at different points in that system. A mechanism diagram cannot select treatment or predict fertility.
PeakedLabs · Educational illustration · Sources checked October 24, 2026. Full explanation: peakedlabs.com/guides/testosterone-explainers#hormone-feedback
What the diagram cannot establish: The arrows simplify physiology. They do not show a dose, a treatment sequence or a guarantee that changing one signal will produce a pregnancy.
Primary sources and dates
- AUA/ASRM male-infertility guideline, Part II (2021)
- Endocrine Society testosterone guideline (2018)
- Pregnyl prescribing information (updated December 2025)
- Kim et al., enclomiphene trial (2016)
Read the evidence in context
Four endpoints that should stay separate
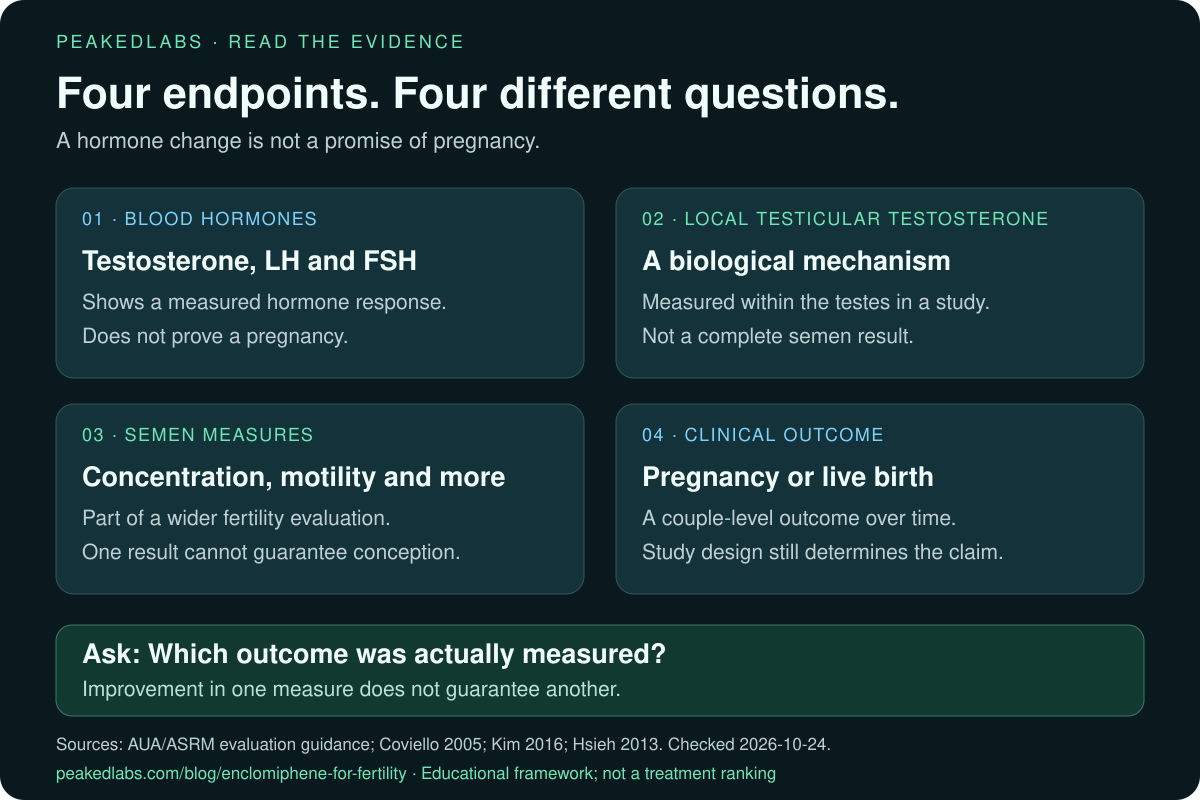
A study can report better hormone or semen measurements without establishing a higher pregnancy or live-birth rate.
PNG: 1200 × 800 pixels for sharing. SVG: scalable version for a closer look.
Caption to use with the image
When reading a fertility claim, ask what was actually measured: blood hormones, testosterone inside the testes, semen parameters, or pregnancy and live birth. These endpoints answer different questions. None can stand in for all the others.
PeakedLabs · Educational illustration · Sources checked October 24, 2026. Full explanation: peakedlabs.com/guides/testosterone-explainers#fertility-endpoints
What the diagram cannot establish: The selected hCG and enclomiphene studies differ in design, size and duration. This graphic is an evidence-reading aid, not a ranking of treatments or an individual fertility forecast.
Primary sources and dates
- Coviello et al., short mechanistic hCG study (2005)
- Hsieh et al., retrospective hCG cohort (2013)
- Kim et al., hormone and sperm endpoints (2016)
- AUA/ASRM infertility evaluation guidance (2020/2021)
Read the evidence in context
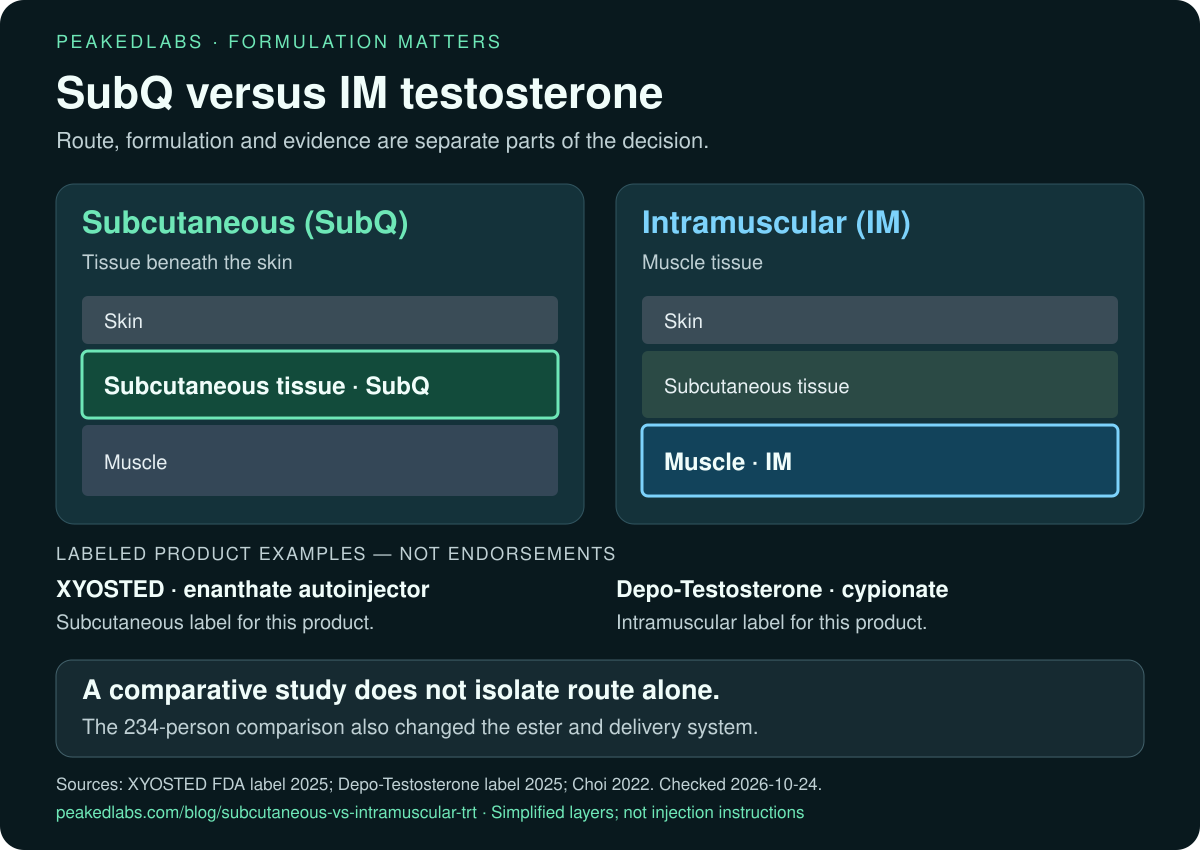
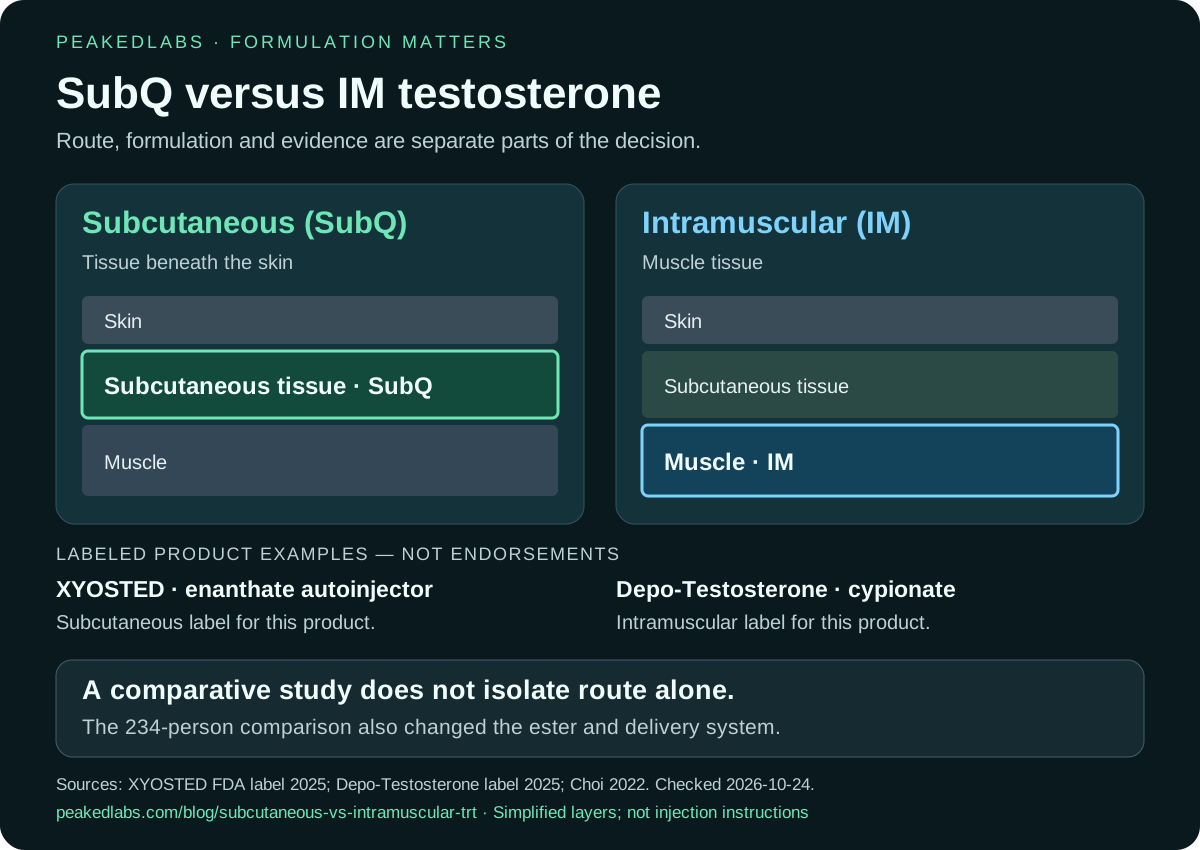
An injection route belongs to the exact product
Evidence for one subcutaneous product does not establish that every testosterone vial can be used by that route.
PNG: 1200 × 850 pixels for sharing. SVG: scalable version for a closer look.
Caption to use with the image
Subcutaneous and intramuscular describe different tissue layers. The exact formulation, product label and device matter. A comparison that changes both route and product cannot isolate route as the cause of every observed difference.
PeakedLabs · Educational illustration · Sources checked October 24, 2026. Full explanation: peakedlabs.com/guides/testosterone-explainers#injection-route-evidence
What the diagram cannot establish: The diagram does not show injection sites, angles, needle choices or technique. Follow the product-specific instructions and training provided by the prescribing clinician and pharmacist.
Primary sources and dates
- XYOSTED FDA prescribing information (July 2025)
- Depo-Testosterone label (September 2025)
- Choi et al., product/route cohort comparison (2022)
- FDA testosterone labeling update (February 2025)
Read the evidence in context
Turn the research into questions you can use.
Organize clinic costs and practical questions with the free decision report. For questions about fertility, symptoms or treatment, use the separate clinician appointment planner and discuss the answers with a qualified clinician.